Green-O-Meter
By James Gammon , Bipin Regmi, Jordan Watkins & Carson Whitt
Intro to Ubiquitous Computing
Advancements in technology are growing exponentially and as these advancements continue we can expect to see technology in a variety of forms becoming ubiquitous in our societies. Ubiquitous computing(UbiComp) is a concept where computing essentially appears everywhere at all times. Advancements in technology have increased the reality of ubiquitous computing and have had profoundly positive effects on our quality of life and will continue to do so. Since ubiquitous computing is omnipresent, a lot of designs ensure that the technology is not too jarring and does not disrupt daily life by incorporating it into appliances and technology that have been commonplace for many years prior to UbiComp advancement. Take smart fridges like this one from Samsung for example (https://www.youtube.com/watch?v=ax29PEORNY0); this new-age technology fits seamlessly with the fridge that we are accustomed to, except it offers far more functionality and ultimately increases the quality of life of those that own one. This captures the importance of UbiComp and why it is so easy to get so excited about. You are essentially upgrading everyday items with increased functionality by seamlessly incorporating new technology. We are living through a technological golden age and UbiComp is at the heart of it, working quietly behind the scenes.
GREEN-O-METER
With that being said, we have come up with a device that captures the buzz of UbiComp while grappling with a problem that we have all had in the past; caring for our plants. It may seem trivial, but many people have had the unpleasant experience of killing a plant. Our theoretical device, Green-O-Meter, is designed to prevent that from happening. Green-O-Meter is a small, light-emitting diode (LED) cube that is placed in a body of soil and turns different colors to indicate different actions the plant owner should take in order to maintain the health of their plant. The Green-O-Meter cube will operate in an internet of things (IoT) system, meaning that the status of all the cubes owned by one individual will be visible from both the cubes themselves and one or more devices at the same time via an accessible software application. We have provided you with a video that outlines the functionality of this device and our excitement in theorizing about it below.
The Green-O-Meter video depicts a young man who is very passionate about gardening. He is clearly very invested in maintaining the health of his plants but when he sees that one of his potted plants is worse for wear he breaks down. Luckily, Mother Nature hears his cries and provides him with a very special device that will not only allow him to nurture his plant back to health, but also maintain the good health of his other plants at the same time. The video shows that the Green-O-Meter changes color to show the young man when his plants are in good shape and when they need some attention. Due to these indicators, the young man is able to revive his dying plant and restore health to his garden!

The image above shows the three main states that the Green-O-Meter will reflect for users. When our cube displays a green color it means that your plant is healthy. When it displays a red color it means that it is in need of more attention than just watering (too much sun exposure, etc.). When it displays a blue color it means that your plant is in need of watering but is otherwise doing well.
Design Steps:
IDEATION PHASE
Now that we have gone a little more in depth about how the Green-O-Meter works, we would like to take a moment to explain how we decided on this idea and the period of ideation that we took in order to mull over other ideas that we had. Before we began thinking about any ideas in depth, we had to come up with them. Each group member took about 20 minutes to write down every UbiComp technology idea that they could think of on a piece of paper. We have included a couple of those lists below.
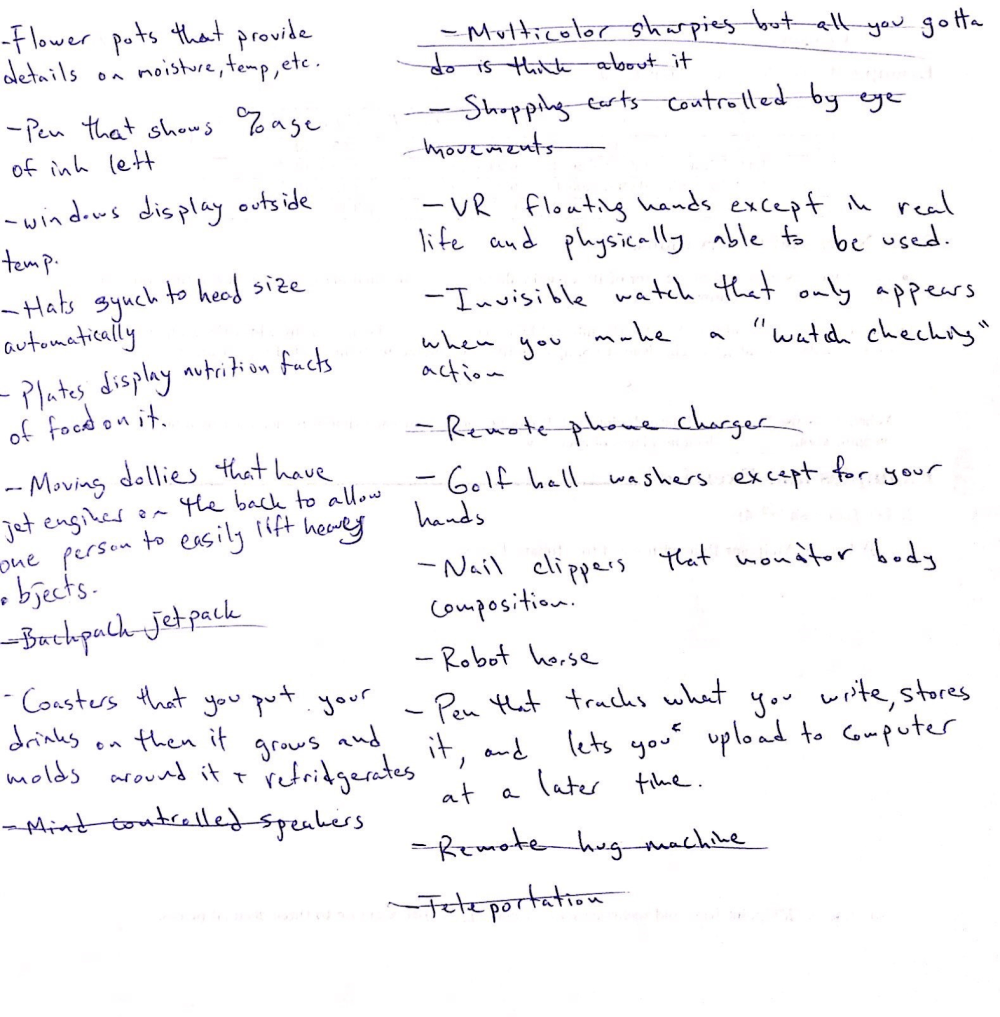
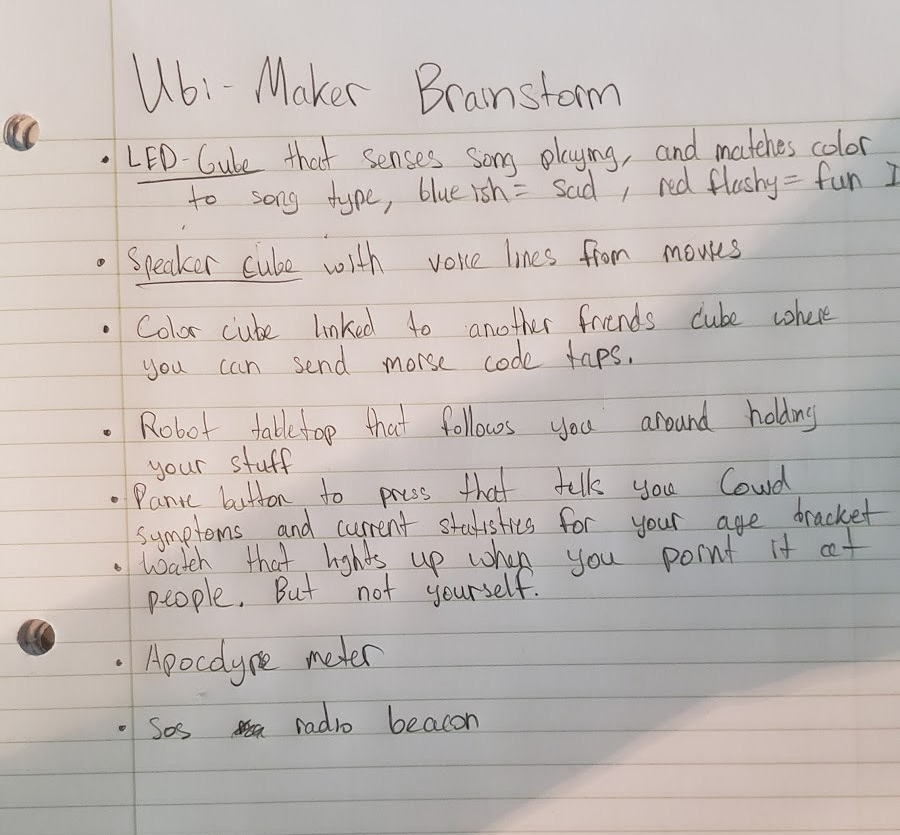
The images above depict an ideation phase that each member of our group completed. The ideas that are crossed out have been removed from consideration.
After this individual phase of ideation, we got together as a group and discussed some of the ideas that each member had come up with. We wrote down a list of the ideas that we all thought had the most potential for our purposes. Our condensed list is below.
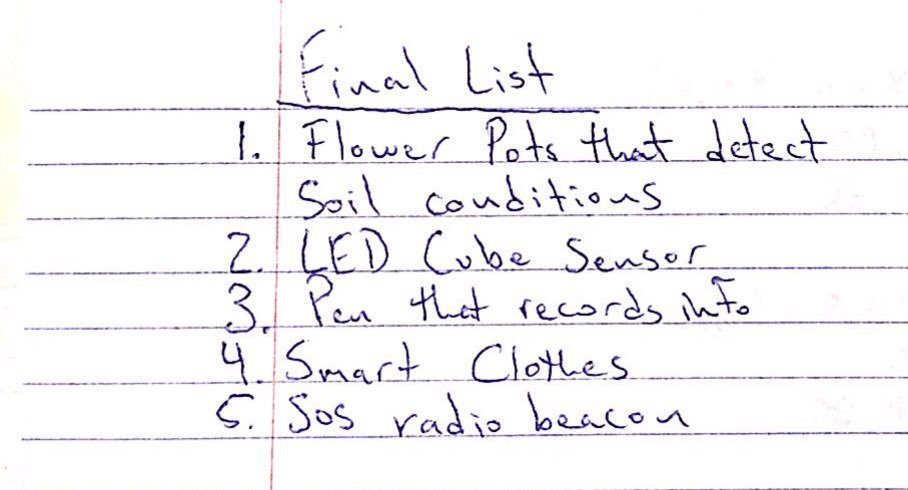
The image above shows our refined list of ideas. The ideas at the top of our list were deemed the most feasible by our group members.
We got lucky with the top idea of our list right away. At first, our idea was to have a flowerpot that displayed all of the conditions of the soil within it. But we decided to simplify that idea by creating an indicator. One of our group members had experience with LED cubes from a personal project he had worked on and pitched that we use these cubes as the indicators, displaying different colors to show the user when their plant needed care and when it was doing well. At this point, we felt good about the direction that Green-O-Meter was going, but we wanted to hear some suggestions and critique from voices that were not directly involved in the theorization of this device.
CREATION PHASE
After finding our central idea we went forth to turn our idea into reality. We created a todo list of the features that we wanted the Green-O-Meter to have. We put our focus to finishing the main ones that provided the most functionality for our product, so we made a more condensed list with
- Cube shell with LEDs
- Moisture sensor
- Light sensor
- Programming
- Solar Panel
1.) The Body of the Green-O-Meter
One of our team members, Carson Whitt, designed and 3D printed a 4x4x4 inch hollow two piece cube to hold all of the hardware needed for the Green-O-Meter.On the outer part of the shell we put holes (9 on each side) to let the LEDs shine through.
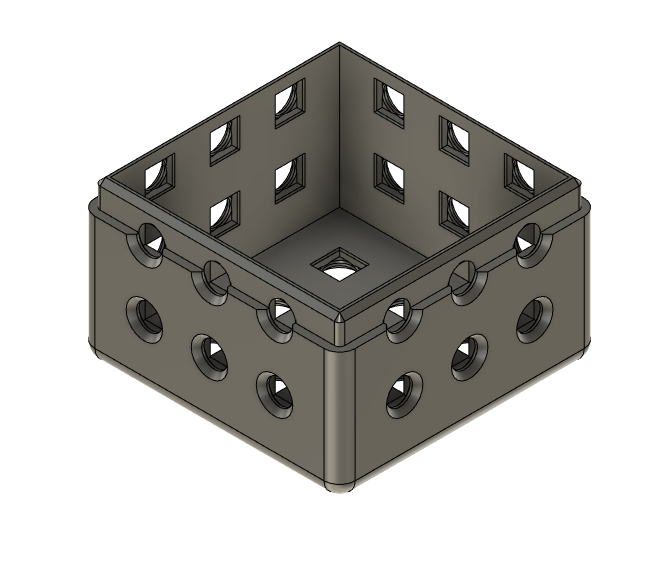
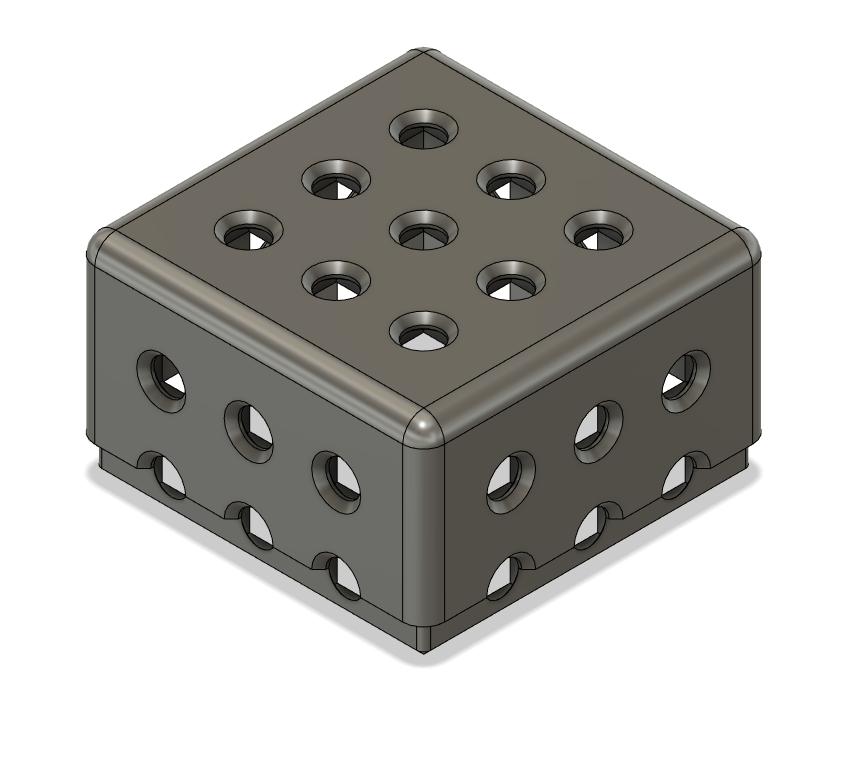
3D cube shell for body of the Green-O-Meter
2.) The Moisture Sensor
Next we focused on implementing the moisture sensor. Given more time we would have used a moisture sensor connected to the cube in order to measure a planter beds water content. We found a commonly used one for similar plant related projects on the hardware resource website Digi-Key. This would work perfectly as we could connect it with a few wires to the brains inside the cube and have it be put in an optimal place in the soil for getting the best reading.

The above picture shows the moisture sensor that we would use for our future improvements.
3.) Light Sensor
We also decided that a future implementation would have a light sensor for determining whether or not the plant is getting adequate light.
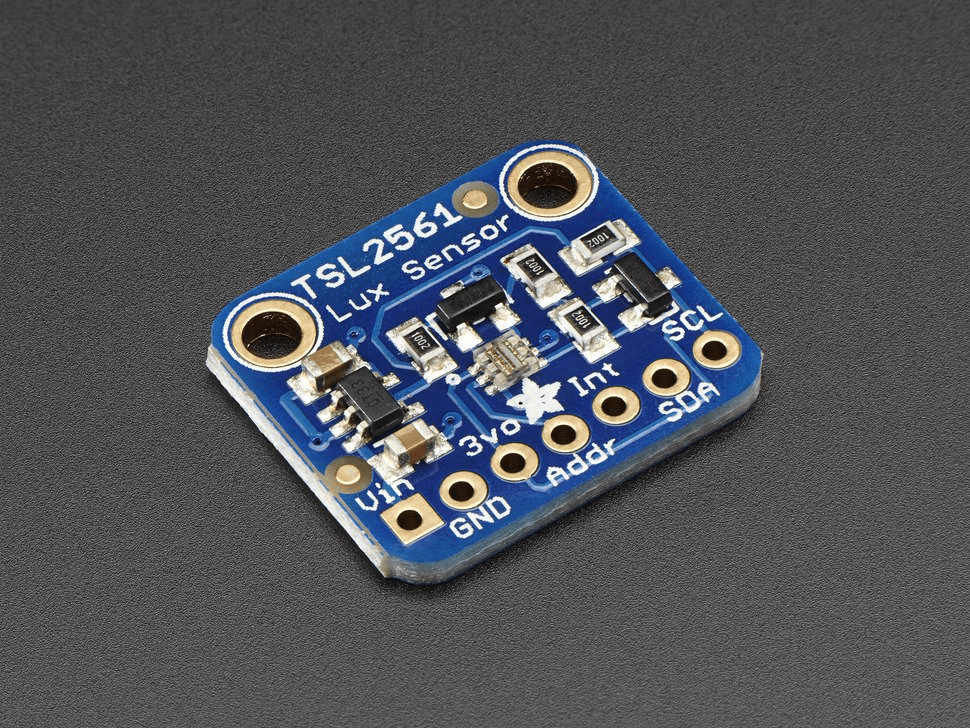
This is the TSL2561 luminosity sensor and works flawlessly with other hardware in the cube. It measures multiple types of light but also has a strong application in measuring the light a plant may or may not be getting.
4.) Programming
For the brains of the Green-O-Meter, we used an Adafruit Feather with Bluetooth LE. Using Arduino we were able to control the LEDs and see the measurements from the moisture sensor. We used the Bluetooth model so that we would have the option to make an app to control and read data from the cubes without having to go out and look at them. This would be high on our list of features to implement in the near future.
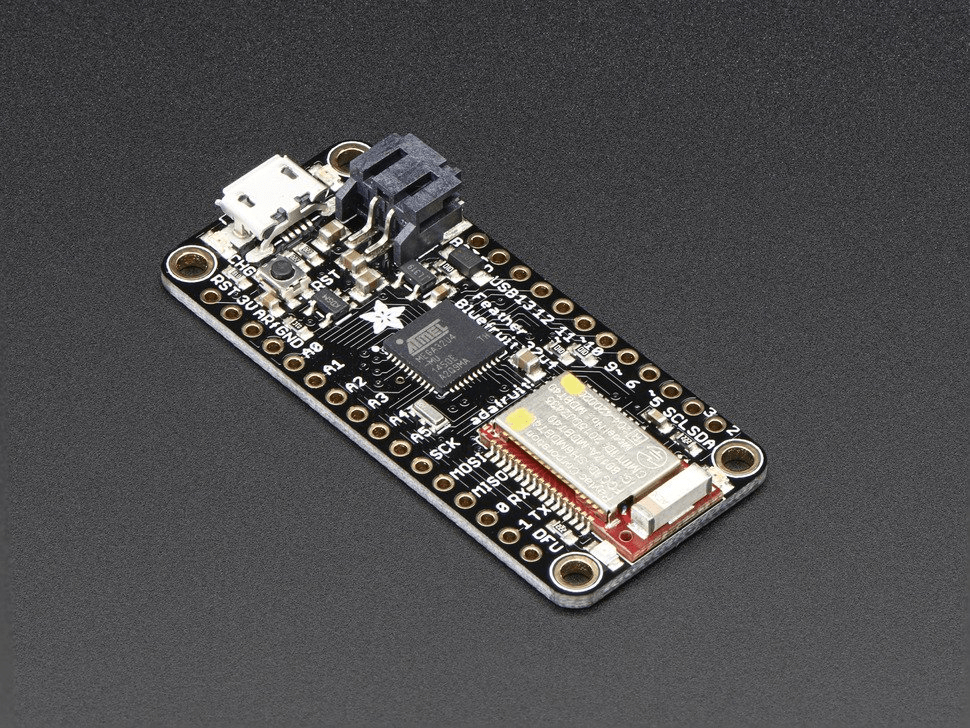
The little computer controlling this whole project! It’s an Arduino compatible board with a Bluetooth LE module. With this we can load the code that we create to run the LEDs and sensors.
For the program to control the Green-O-Meters we made a pseudo code function to change the LEDs based on the data from the sensors. Below is the flow diagram outlining the looping function going on inside the cubes.
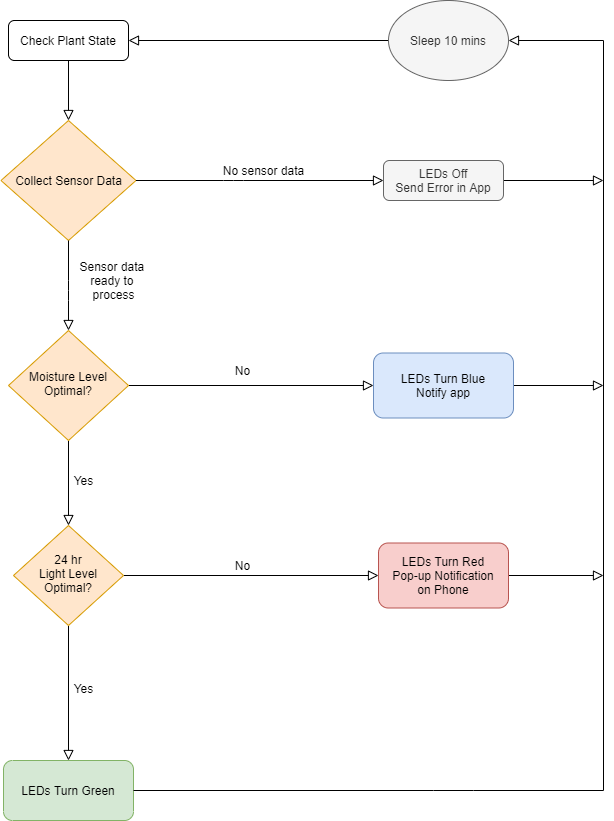
The flow diagram above shows the function controlling the lights in the cubes. The sleep for 10 mins is used to help save battery life. This diagram also shows mobile app functionality as well.
5.) Solar Panel
Lastly we want to include solar functionality to better add to the natural application in outdoor plants. Powering LEDs doesn’t actually take a whole lot of power so using a solar cell is an easy way to make the Green-O-Meter a better product, especially considering it will be outside all day. Below is a solar cell that can easily be integrated with our current hardware setup. It provides max 3.6 V and 100 Mah which is perfect for charging the battery inside our cubes to let lighting during day and night be possible.

The image above is the SC10036 solar cell that we found on Digi-Key. Many other Arduino Maker projects use this solar cell so it would be perfect for our applications.
SURVEY PHASE
With the intention to get some outside thoughts on the Green-O-Meter, we sat down as a group and created a survey that encapsulates the goal of our device; to aid in the With the intention to get some outside thoughts on the Green-O-Meter, we sat down as a group and created a survey that encapsulates our goal to aid in the successful care of plants. We have included the survey link below and urge you to complete it if you have not already so that we can continue evolving our ideas courtesy of your insight.
https://sonoma.az1.qualtrics.com/jfe/form/SV_bggOX4SzZJ3zwhf
This survey was created so that we could get a better idea of what plant ownership means to people and how much they care about plant care. We lead off our survey with a few preliminary questions of whether or not the participant owns indoor or outdoor plants. We follow those inquiries up with a few questions about the respondent’s knowledge of how to care for their plant and then we subtly pitch our product and see if surveyees would be interested in using the Green-O-Meter. We decided to conclude our survey with a couple of questions that essentially ask the respondent for suggestions and feedback. The goal of this survey was to get a grasp on how many plant owners would be inclined to use the Green-O-Meter and if the device would motivate those that do not own plants to get some.
We received a pretty wide spread of results but were able to pick out some trends in our data. Most of the data we received from our earlier questions are qualitative so we are able to show you guys a couple of graphs that describe the general trends of our answers. First, we found that the majority of our surveyees(about 55%) had outdoor plants while only about 41% of respondents had indoor plants. We predicted that this would be the case, but the results about the care that each type of plant received through us for a bit of a loop. We expected indoor plants to have a higher level of care than outdoor, but that was not the case. In fact, the mean amount of care was almost exactly the same between the two, only favoring more care for outdoor plants by 10%, as seen in the figures below.

The data above shows the results of our question, “How often do you tend to them [outdoor plants]?”

The data above shows the results of our question, “How often do you tend to them [indoor plants]?”
As we continued to look over our data, we discovered that there was a very positive response to the proposition of our device. A combined 84% of respondents who had either outdoor or indoor plants responded that they would be either “interested” or “somewhat interested” in using our proposed Green-O-Meter device. You can see that data in the figure below.

The data above shows the results of our question, “How interested would you be in using an automated device that indicates when you should water your plants?”
In this survey, we did not offer much detail on how Green-O-Meter would work or what it would look like, but that did not stop respondents from reacting positively to the idea. This makes us think that if we offer more details to the basic concept that we outlined for respondents, that our responses will be even more positive. We also had some positive findings from our other possible set of questions for the survey. We were able to use a logic system to determine which questions should follow others in order to maintain question consistency for respondents. This allowed us to shift respondents who had no plants at all (indoor or outdoor) into a new line of questions that gauged the chances of the respondent getting a plant in the future. If the respondent answers no they are sent to the final question of our survey, while those who answered yes are sent to a question whose results also suggested a positive interest in the Green-O-Meter as seen from the figure above..
Finally, we received some great feedback and ideas from respondents, but we will discuss those suggestions when we address improvements to our prototype later in the article.
STRENGTHS/WEAKNESSES OF FINAL PROTOTYPE
After we received feedback from our survey respondents, we felt confident that we could mock up a strong first Green-O-Meter prototype. As we described in the leading paragraphs of this article, Green-O-Meter captures the excitement of UbiComp and gives its users the opportunity to maintain their plants’ health. One of our respondents offered some really valuable advice that we decided to include in this prototype. They suggested that we utilize the internet of things system to make the information provided by Green-O-Meter more accessible to users. So we thought about a software application that would display the data collected by the device while it continued to indicate conditions by changing the colors of its LED lights. We think that this device would be an effective way of indicating conditions for plants and the results that we received from our survey support that notion.
However, we did notice some weaknesses in the device; the most important being the lifetime of our LED lights. We were concerned that if the device displayed its lights at all times then they would die quickly. We thought that we could keep them off at certain times and turn them back on at others. This proved to be a problem as well because the cube may be powered off when a user wants to know how their plant is doing. So we decided to simply add solar panels to the top of the cube to recharge a battery that powers the LED lights. To take this one step further, we decided that we would include a motion activated sensor that only displays the lights when someone is nearby. The cube will always monitor conditions and send data to supplementary devices, but will only display lights when someone is nearby in order to preserve power.
The Green-O-Meter device is still very early in its theoretical development process, so we have a lot of improvements that we intend to flesh out to evolve and improve this prototype. These ideas come from our team members and from the suggestions we received from the survey that we released to our family, friends, and classmates. The majority of the suggestions we received had something to do with the Green-O-Meter tracking soil composition and outdoor conditions like levels of sunlight.
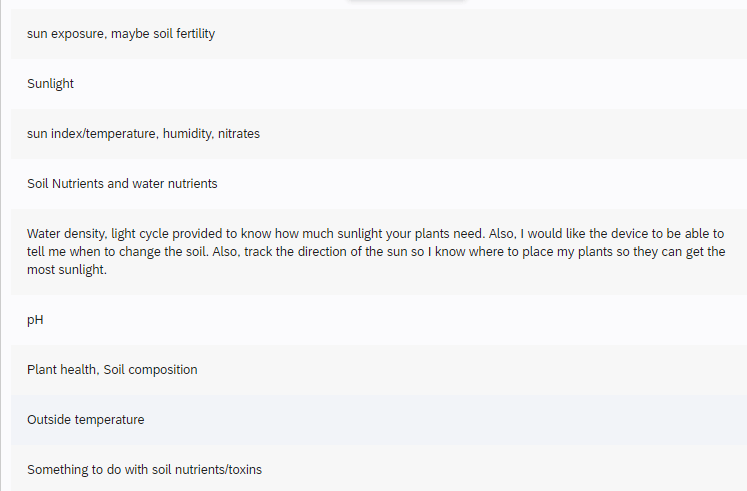
The figure above shows the most common words in response to our question, “If this device was able to track other properties of a plants environment, what additional indicators, if any, would you like to see included (other than soil moisture)?”.
With the help of the internet of things system that we plan to use alongside this device, we know that we can implement technology that tracks a good amount of additional environmental conditions such as the pH of the soil and outside temperature. Each newly tracked condition will correspond to a new color that the cube will display when action needs to be taken and data will be sent from the cube to a device that has the appropriately linked software application for easy viewing of more concrete data.
In addition, we added a question that asked users if they had had troubles in the past with animals disrupting their plants. As you can see in the figure below we had 65% of respondents answer that they had.

The data above shows the results of our question, “Have you had any issues with animals disturbing your plants in the past?”.
Because of the results shown above, we decided to include a feature that flashes bright colors and vibrates to scare away animals when it senses that they are near. Without the constructive feedback that we received from our survey, our final prototype would not be all well rounded as it is. The feedback allowed us to include new features that should have been considered in the first place.
CONCLUSION
The beauty of this device is its simplicity. You can use it as an indication device that lights up and clearly shows the user when their plants are in need of attention or you can use it as a data collection device that streams information about your plants’ soil and environmental conditions straight to your smart device of choice. It took a good amount of steps to get to where we are now with this device. We ran into a lot of problems with our idea but were able to work around them with the help of insight from our survey respondents. We think that this device captures the principles of ubiquitous computation effectively. We are very excited about the Green-O-Meter and can not wait to continue theorizing about it and developing new ideas to increase its effectiveness and accessibility.
We thank you for taking the time to review it and request that you feel free to provide critique or ideas in the comments below.
